Banned
team_Gerkule_s
team_kkt09
Banned
Banned
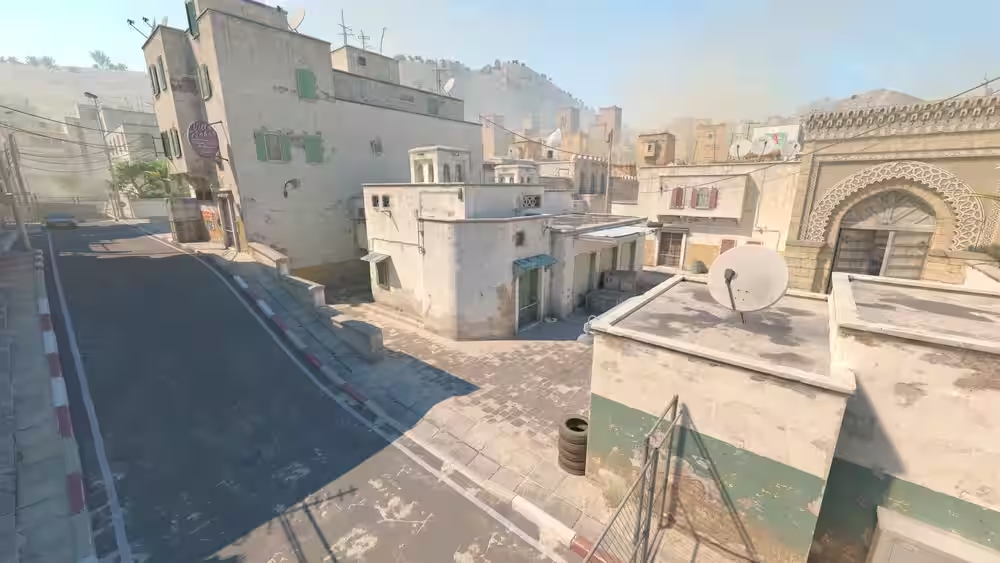
Banned
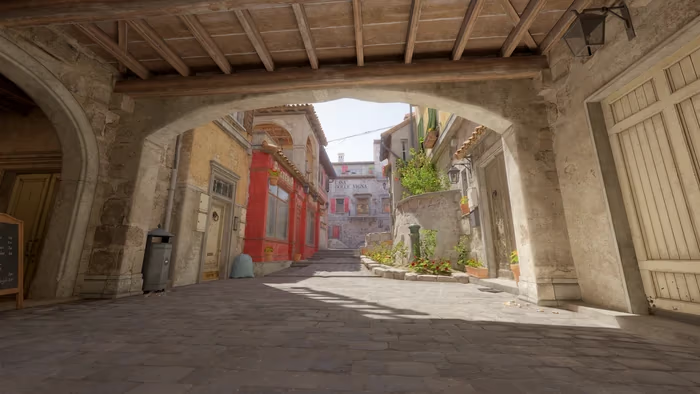
Banned
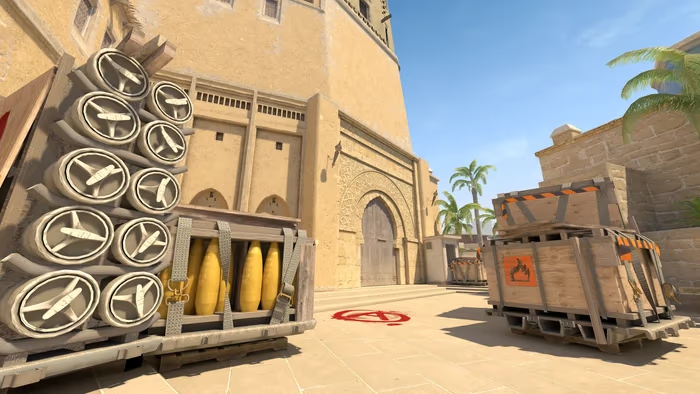
Banned
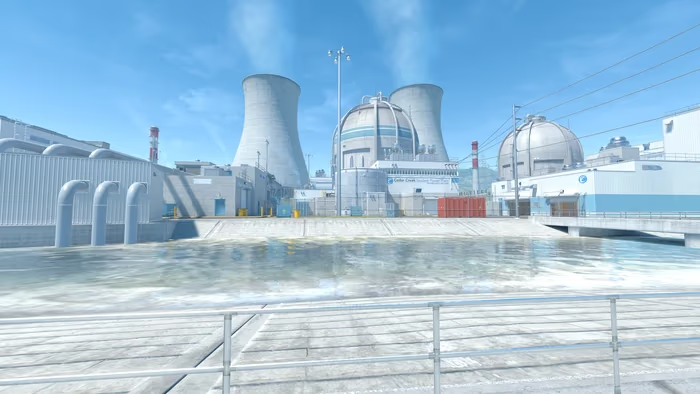
Banned
Picked

team_Gerkule_s
Win
5 players · 24 rounds
24 rounds played: CT won 11 (46%), T won 13 (54%).
Round-by-round score progression

Takeaways
team_Gerkule_s won 6 straight rounds (15–20). What changed at the start of that run?
The match debrief
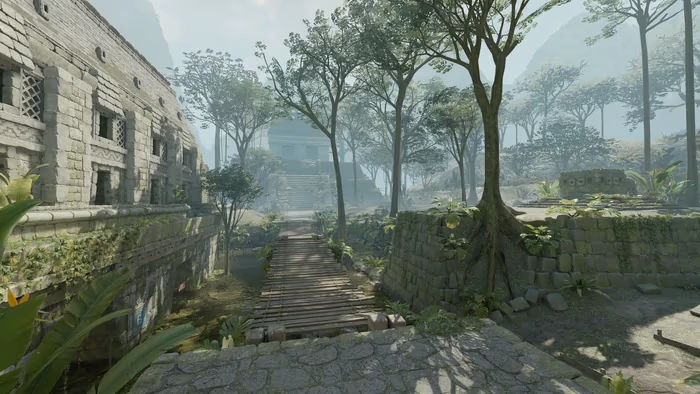
team_Gerkule_s beat team_kkt09 13–11 on Anubis. The scoreboard tells you who won. The useful part is seeing how it happened.
Follow the match from the first duel to the final trade. Compare player impact, read the economy, check utility value, and revisit the rounds where control changed hands.
Final score on Anubis
team_Gerkule_s
13team_kkt09
11Built from official FACEIT and Steam match data.
A simple review rhythm
Start broad, follow the pressure, then return to the rounds worth studying twice.
Opening duels and trades show who created the early advantage and whether their teammates converted it.
Economy, buy decisions, and utility use explain which rounds were shaped before the first shot.
Damage, site control, timelines, and heatmaps reveal where pressure built and momentum changed.