team_KIFIR4K vs team_Soczi_
FACEIT · Europe 5v5 Queue · EU
- Started
- Aug 24, 2026 · 03:14 PMUTC
- Duration
- 40m
- Rounds
- 24 Rounds
Map veto
- Ancient
- Anubis
- Cache
- Dust2
- Inferno
- Nuke
- Vertigo
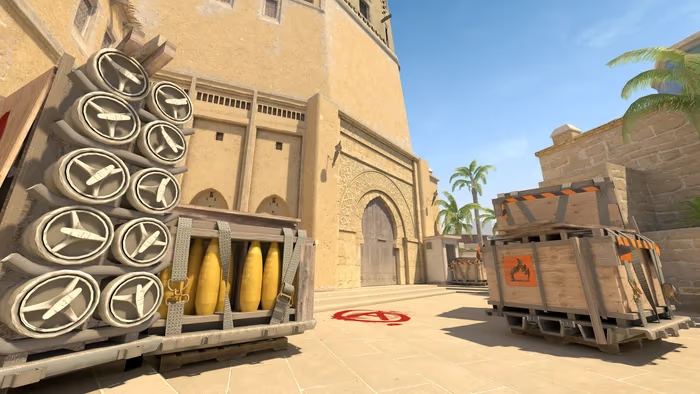
- Mirage Picked





Mirage picked · 7 banned
- Ancient
- Anubis
- Cache
- Dust2
- Inferno
- Nuke
- Vertigo
- Mirage Picked
Down 1–6. team_KIFIR4K won 13–11.
| Team | Half 1 | Half 2 | Final |
|---|---|---|---|
| team_ | 5T | 8CT | 13 |
| team_ | 7CT | 4T | 11 |







team_KIFIR4K trailed 1–6 after round 7, then won 12 of the last 17 rounds.
Round by round
team_KIFIR4K trailed by 5 after round 7. The lead changed hands 3 times. Final score team_KIFIR4K 13, team_Soczi_ 11.
Select a round to see how the winning team took it.
- Elimination
- Bomb exploded
- Bomb defused
- Round end not recorded
- Standout round
Half 1
team_KIFIR4K T 5
team_Soczi_ CT 7
Half 2
team_KIFIR4K CT 8
team_Soczi_ T 4
Rounds won
24 rounds played: CT won 15 (63%), T won 9 (37%).

- CT wins
- 15 63%

- T wins
- 9 37%
63% CT sided 24 rounds played
How it's measured
- The story comes from recorded round winners and the final score. It picks the first that applies: a comeback from three or more rounds down, overtime, a win by eight or more, a 10-round half on one side, an equipment heist that ended the match or came before another round win, a final-round clutch, then the winner's longest run.
- Talking points and awards compare the players in this match only. A tie for the top value gets no award. Equipment is the recorded team value at the start of the round.
- The win estimate counts players alive on each side after every kill. It does not account for position, equipment or the bomb.
- Map win chance estimates the result from the score, each side's usual round win rate on this map, and how often pistol winners win the next two rounds. These rates come from public JumpThrow matches. It does not account for money or players. There are too few public matches yet, so it uses the score alone and treats every round as even.
- This match was analysed before kill modifiers, clutches and round equipment reached match stories. Notable kills, awards and the round of the match are not available yet.
Scoreboard
Full match · 24 rounds · 10 players
Sorted by Rating 3.0, highest first. KIFIR4K leads the lobby with 1.56.
Scroll to compare stats
| Player | ||||||||||||||
|---|---|---|---|---|---|---|---|---|---|---|---|---|---|---|
Match score 13 team_KIFIR4KWinner | ||||||||||||||
| 1.56Lobby best· Unique team high | 24· Unique team high | 8· Unique team high | 19 | +5 | 1.26· Unique team high | 118.9· Unique team high | 70.8% | 1.00· Unique team high | 58.3% | 5 | 2.7 | 36.0· Unique team high | 33.3 | |
| 1.36 | 18 | 7 | 15· Unique team low | +3 | 1.20 | 85.8 | 75.0%· Unique team high | 0.75 | 61.1%· Unique team high | 5 | 3.0· Unique team high | 22.3 | 52.9 | |
| 1.19 | 21 | 3 | 21 | 0 | 1.00 | 82.8 | 54.2% | 0.88 | 52.4% | 1 | 1.0 | 23.0 | 40.5 | |
| 1.17 | 17 | 3 | 17 | 0 | 1.00 | 72.6 | 62.5% | 0.71 | 52.9% | 2 | 1.9 | 21.0 | 43.9 | |
| 0.38 | 5 | 6 | 18 | -13 | 0.28 | 29.0 | 54.2% | 0.21 | 40.0% | 0 | -6.0 | 6.9 | 59.1· Unique team high | |
Match score 11 team_Soczi_ | ||||||||||||||
| 1.51· Unique team high | 22· Unique team high | 4 | 14· Unique team low | +8 | 1.57· Unique team high | 92.8· Unique team high | 66.7% | 0.92· Unique team high | 59.1% | 4· Unique team high | 4.0· Unique team high | 22.4 | 76.2· Unique team high | |
| 1.29 | 19 | 5· Unique team high | 16 | +3 | 1.19 | 91.7 | 79.2%· Unique team high | 0.79 | 21.1% | 2 | 0.3 | 22.5 | 62.8 | |
| 1.23 | 21 | 4 | 20 | +1 | 1.05 | 92.2 | 75.0% | 0.88 | 71.4%· Unique team high | 3 | -1.0 | 23.9· Unique team high | 61.8 | |
| 1.16 | 18 | 4 | 18 | 0 | 1.00 | 89.3 | 75.0% | 0.75 | 38.9% | 1 | -1.6 | 21.6 | 53.9 | |
| 0.59 | 9 | 2 | 18 | -9 | 0.50 | 41.3 | 54.2% | 0.38 | 33.3% | 1 | -4.3 | 11.8 | 31.2 | |
How it's measured
- Rating 3.0
- A reconstruction of Rating 3.0. Parsed matches use it as the main rating when it is available.
- K
- Kills, the total number of eliminations
- A
- Assists, the number of kills the player assisted
- D
- Deaths, the number of times the player was eliminated
- +/-
- Plus/Minus, kills minus deaths
- KD
- Kill/Death Ratio
- ADR
- Average Damage per Round
- KAST
- Kill, Assist, Survive, or Trade percentage
- K/R
- Kill Rate, kills per round
- HS%
- Headshot Percentage
- MVP
- MVP Awards
- RS
- Round Swing, the average change in win probability the player caused per round
- ECO
- ECON Rating, damage per 1,000 of equipment value
- UTIL
- Utility Rating, the geometric mean of grenade quantity and sample-adjusted quality on a fixed 0-100 scale
Select a column to sort by it. Bars in the sorted column share one scale across the lobby.
Highlights mark a unique team high, or a unique team low for deaths, first deaths and teammates flashed. Ties and the signed differences +/− and OD get no highlight.
A dash means unavailable, not zero. Select a player to open their profile.
Top performers
All rounds Ranked by Rating 3.0
Imback_hypex led the Rating after 17 of 24 rounds. KIFIR4K took it in the final round.
- Rank 1 KIFIR4K MVP team_
KIFIR4K Led after 1 of 24 rounds 118.9 damage per round, the most in the lobby. - Rank 2 Imback_
hypex team_ Soczi_ Led after 17 of 24 rounds - Rank 3 GEOGEO27 team_
KIFIR4K Highest position: 2nd
How it's measured
The ranking and each rating are the match Rating 3.0, as in the scoreboard. Every round also has its own Rating 3. Each row's bars show that player's Rating 3 in each round. The top three share one scale. A dashed line marks 1.00, and a gap marks where teams switched sides. A bar is in full colour, with a mark above it, when that player had the best average round rating after the round. Picking a round ranks the standings by that average. After the last round, the standings use the match Rating 3.0. The bars leave out rounds without a Rating 3.